Appearance
Table Builder - Charts Menu
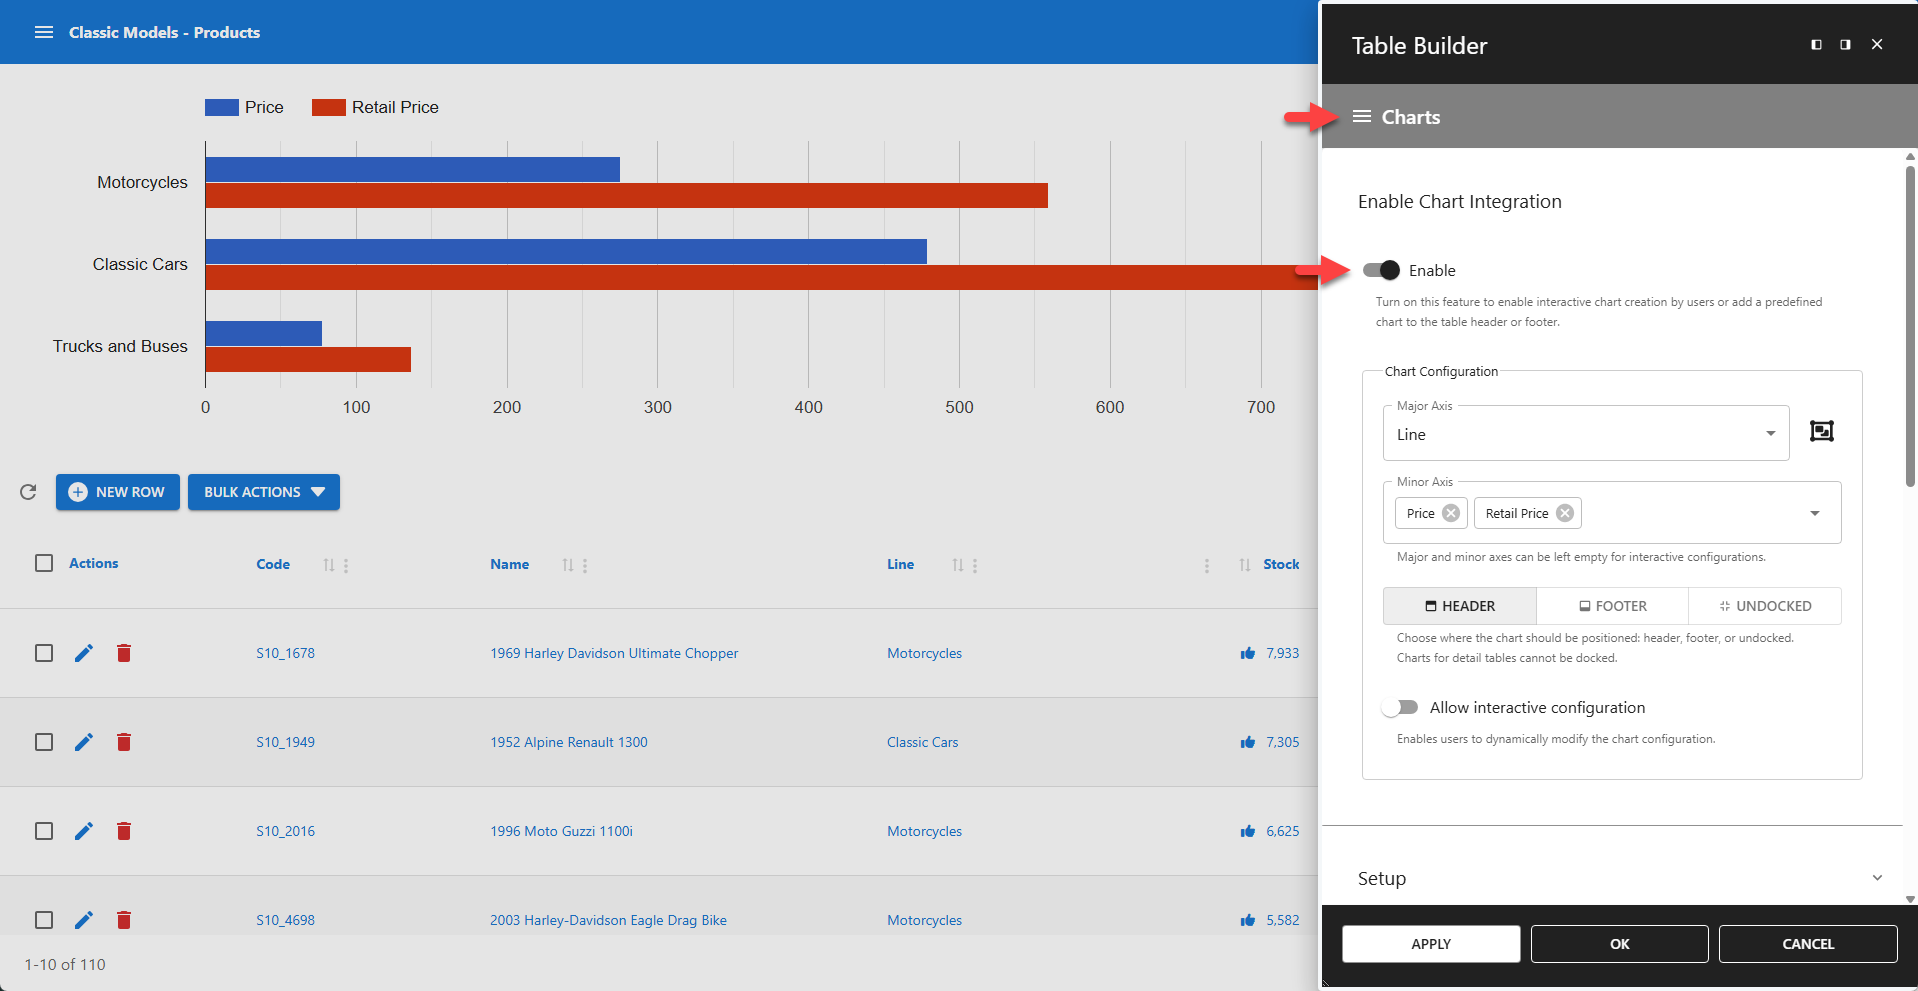
The Table Builder supports adding charts to the table header or footer. The chart is drawn using the table data shown on the current page. When the user switches pages, performs a search, or reorders rows, the chart is automatically redrawn.
⚙️ Enabling Chart Integration
Clicking the enable switch activates chart integration.
Enabling Chart Integration adds all Chart Builder menu items to the Charts Menu. Please visit the Chart Builder section for a detailed explanation of the available chart options.
> Go to the Chart Builder Documentation
Chart Configuration
The major and minor axes can be left empty for interactive configurations, allowing the user to perform interactive analyses. To add a predefined chart to the table header or footer, the major and minor axes must be defined.
⚙️ Major Axis
Select the column to be shown on the major axis.
⚙️ Minor Axis
Multiple columns can be shown on the minor axis. A column can be shown multiple times using different calculations.
Calculation
Defines the arithmetic function applied to the column values currently displayed on the page.
- AVG – Average of the column values
- COUNT – Number of column values (same for all columns)
- MAX – Maximum column value
- MEDIAN – Median of the column values
- MIN – Minimum column value
- STD – Standard deviation
- SUM – Sum of all column values
- UNIQUE – Number of unique values in the column
- VARIANCE – Variance of the column values
📌 Supports only numeric values.
📌 Values are shown in the order they are added here.
⚙️ Grouped By
Allows grouping of values.
⚙️ Chart Position
Defines the chart position.
- HEADER - Adds the chart to the table's header.
- FOOTER - Adds the chart to the table's footer.
- UNDOCKED - Adds a button that the user must click to view the chart.
📌 Charts for detail tables cannot be docked.
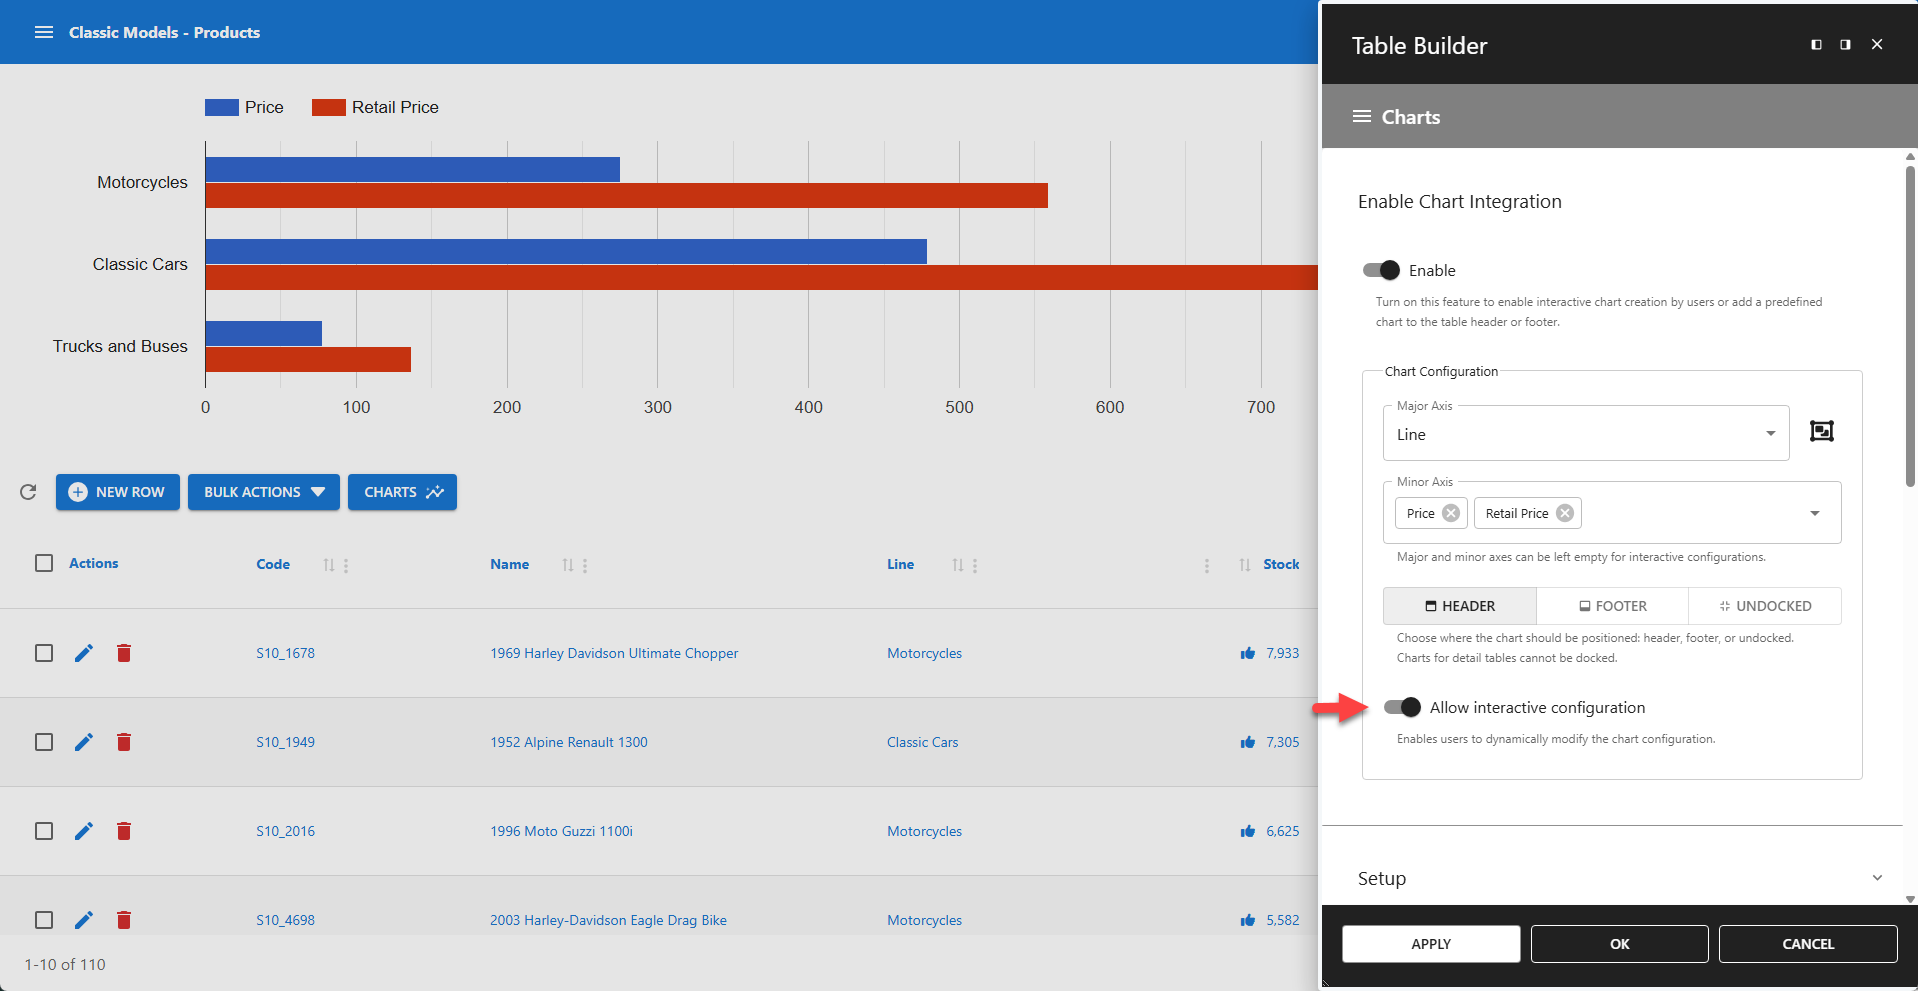
⚙️ Allow Interactive Configuration
Enables users to dynamically modify the chart configuration.
Interactive Configuration
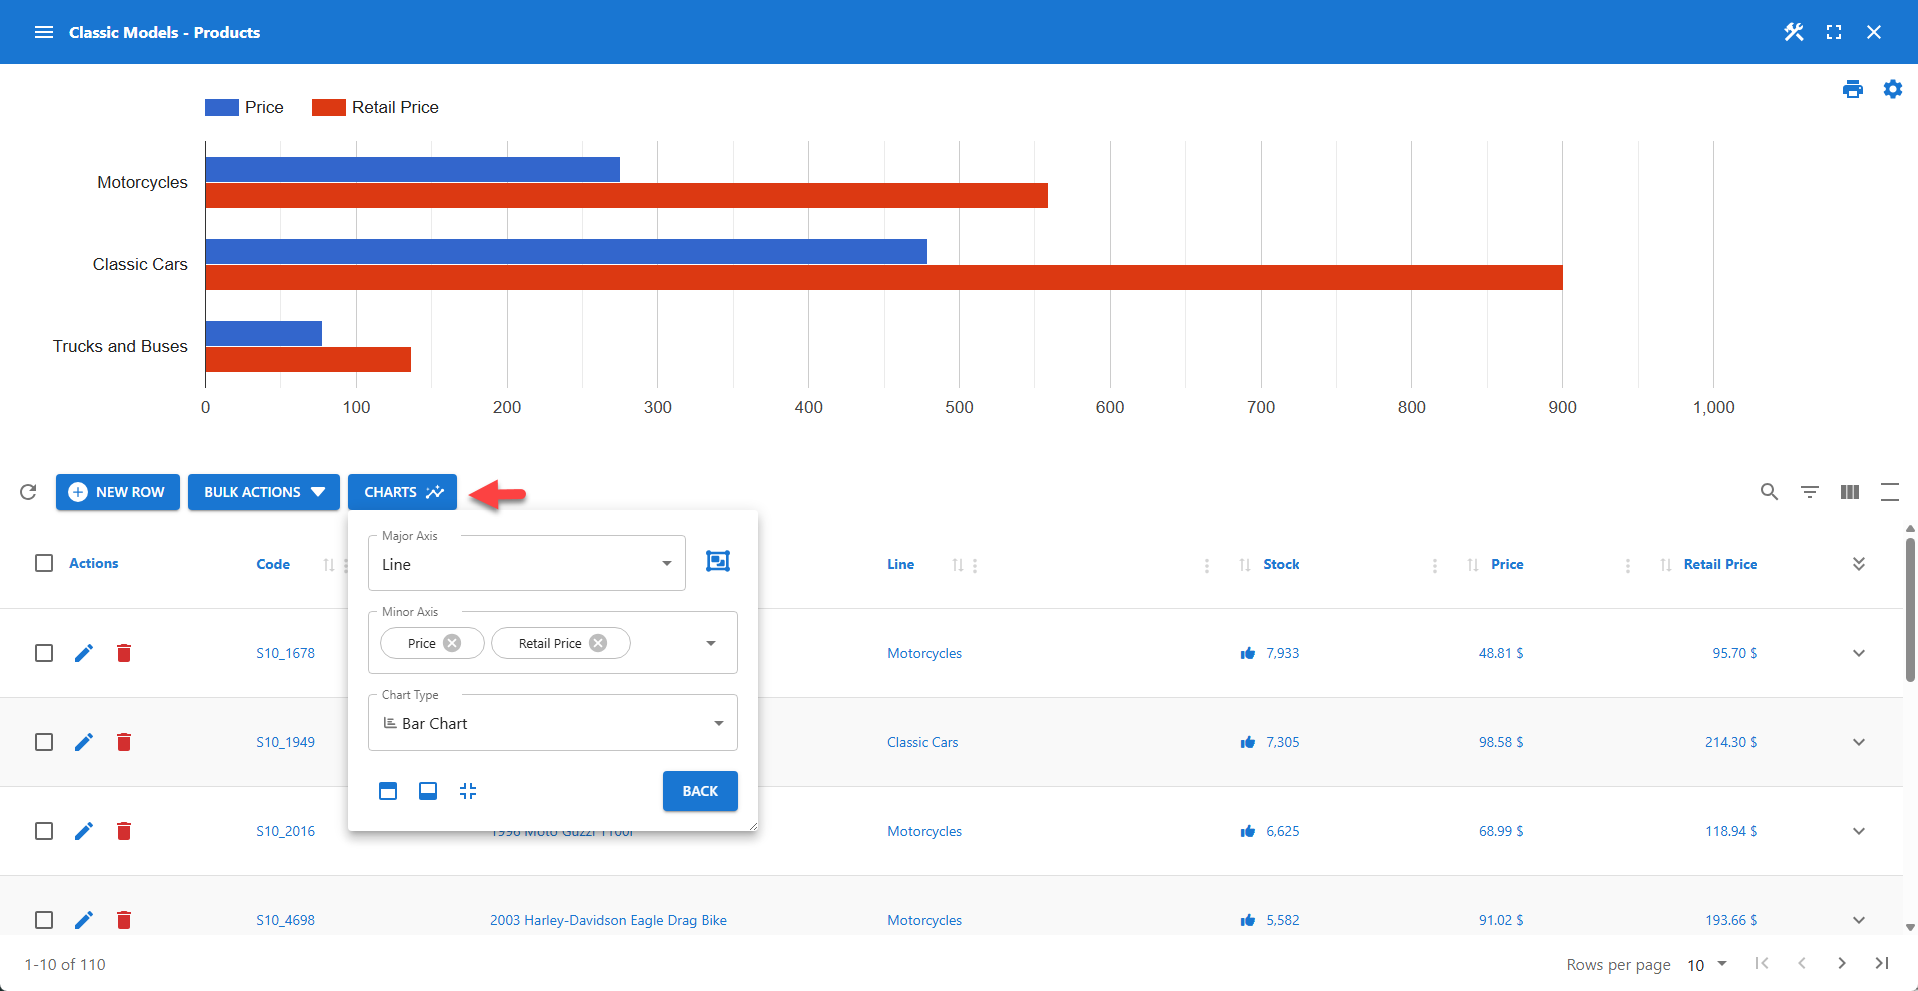
📌 LEFT: Enable interactive configuration in the Table Builder.
📌 RIGHT: User can interactively configure the chart via the button.
Direct Links to the Chart Builder Documentation
> Setup
> Chart Types
> Settings
> Title & Legend
> Colors
> Axis
> Chart Area
> User Interaction
> Custom Options
> Custom Events