Appearance
Axis
Optionally adds titles to the horizontal and vertical axes. Additionally, supports a min and a max value for both axes to define their visible ranges.
💡 Users can modify these settings interactively if allow user to change chart settings is enabled.
💡 The min and max values of the horizontal and vertical axes define the visible ranges of the chart. They control how the data is displayed visually, allowing users to focus on specific value ranges or ensure consistent scaling across multiple charts.
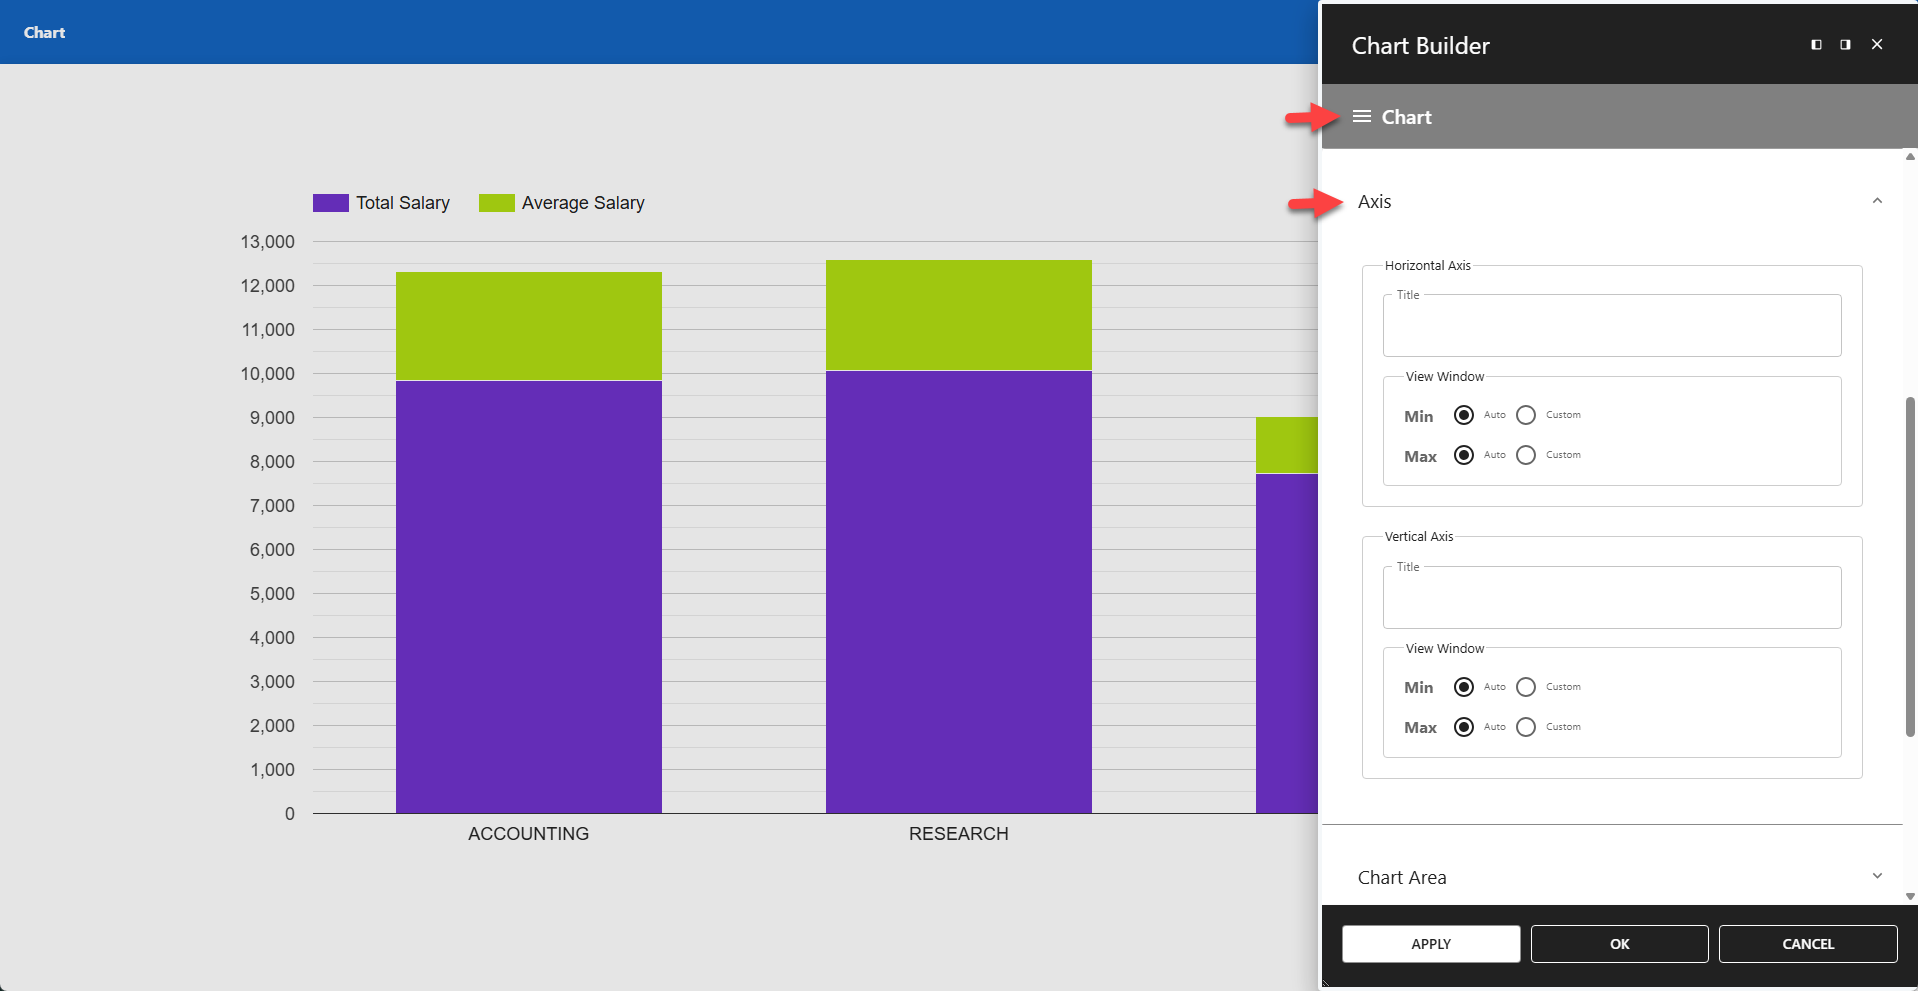
Horizontal Axis
⚙️ Title
A title is optional.
⚙️ Min
- Auto - Google Charts will automatically calculate the minimum value based on your dataset to optimize the display.
- Custom - Defines the lowest value displayed on the axis. Any data points below this value will be truncated or may not be visible.
⚙️ Max
- Auto - Google Charts will automatically calculate the maximum value based on your dataset to optimize the display.
- Custom - Defines the highest value displayed on the axis. Any data points above this value will be truncated or may not be visible.
Vertical Axis
⚙️ Title
A title is optional.
⚙️ Min
- Auto - Google Charts will automatically calculate the minimum value based on your dataset to optimize the display.
- Custom - Defines the lowest value displayed on the axis. Any data points below this value will be truncated or may not be visible.
⚙️ Max
- Auto - Google Charts will automatically calculate the maximum value based on your dataset to optimize the display.
- Custom - Defines the highest value displayed on the axis. Any data points above this value will be truncated or may not be visible.