Appearance
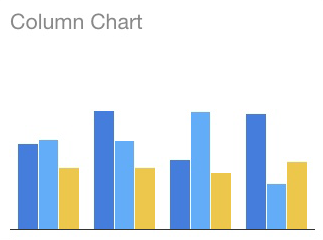
Column Chart
Uses vertical bars to represent data, effective for showing changes over time or comparisons among items.
Query

Must contain at least one string or date column and one numeric column.
| Column | Type |
|---|---|
| First | string or date |
| Other | numeric |
Examples
✨ Example
The first column,
city, is a string. The second column,population, is numeric.
sql
select city, population
from population
✨ Example
The first column,
dname, is a string. The additional columns are numeric.
sql
select	dname				as "Department"
,		sum(ifnull(sal,0))	as "Total Salary"
,		avg(ifnull(sal,0))	as "Average Salary"
from emp right join dept on emp.deptno = dept.deptno
where (dname like httpGet['dname'] or httpGet['dname'] is null)
and (dname like shortCodeParam['dname'] or shortCodeParam['dname'] is null)
group by dname
order by dname