Appearance
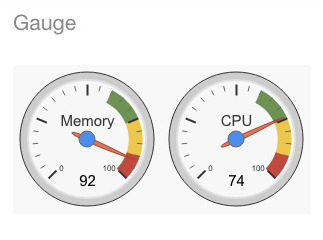
Gauge
A dial-type chart that displays a single value within a defined quantitative range, often showing performance against a goal.
Query
Must contain one string or date column and one numeric column. Draws a gauge for each row and additional gauges for each added column.
| Column | Type |
|---|---|
| First | string or date |
| Second | numeric |
✨ Example
The first column,
city, is a string. The second column,population, is numeric.
sql
select city, population
from population
💡 Keep the number of selected rows and columns low (less data = more readability).