Appearance
Getting started with the Chart Builder
Both free and premium users have access to the Chart Builder. The two versions have identical user interfaces. The most important differences between the free and premium versions are:
- The premium version allows users to print charts.
- The premium version allows users to interactively adjust chart settings.
- The premium version supports docking charts to table headers and footers.
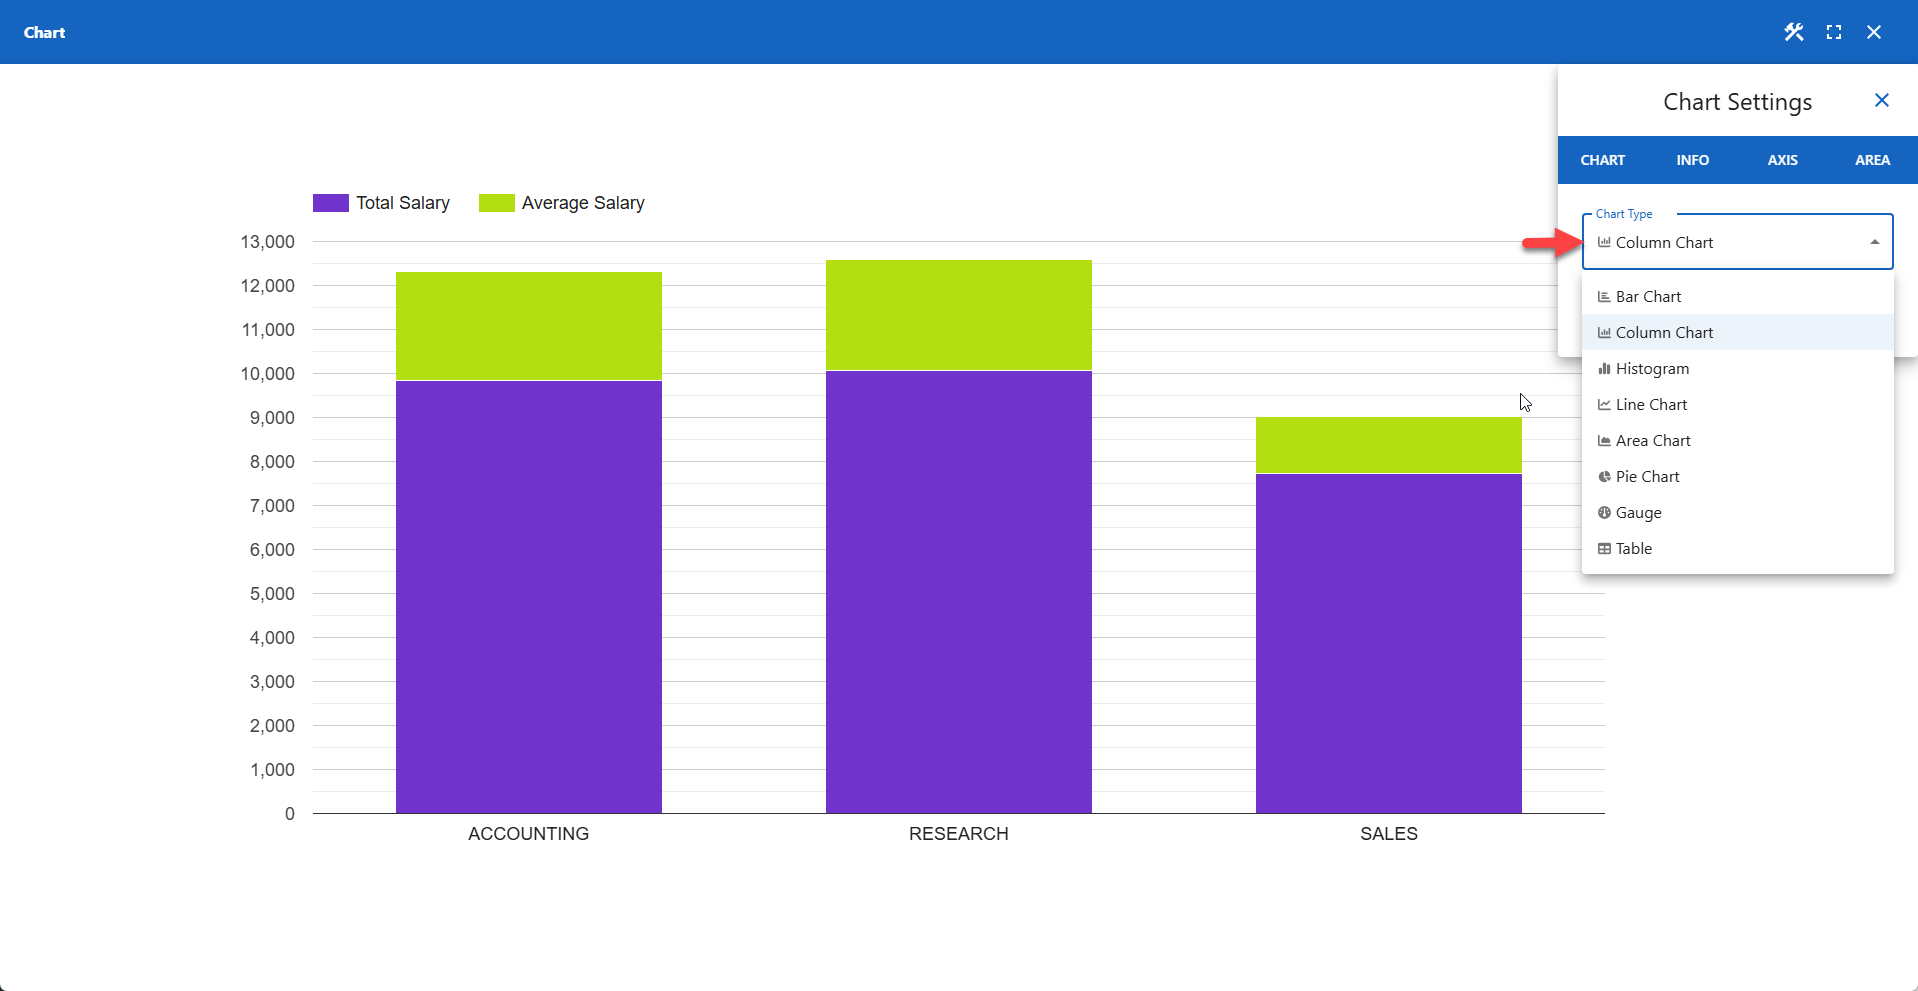
Supported Chart Types
TIP
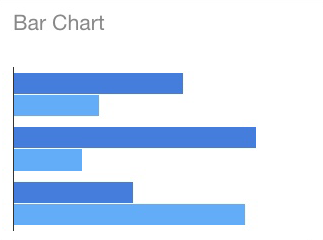
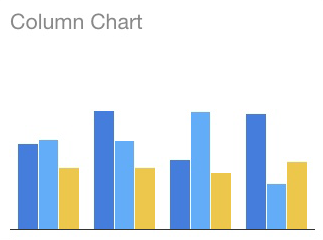
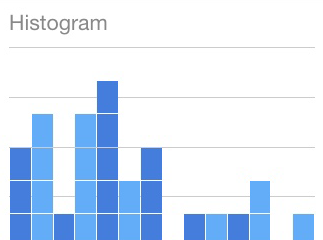
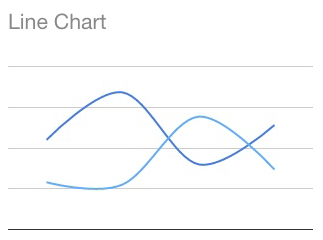
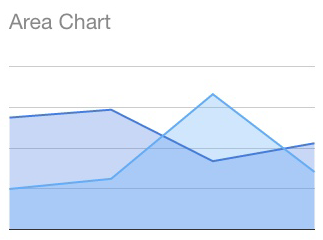
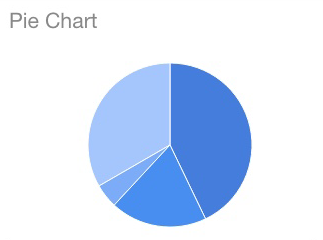
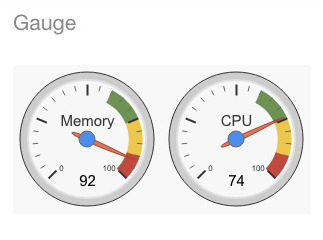
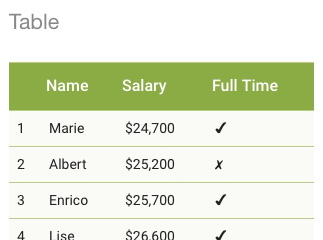
Chart Data
Chart Data is generated from SQL queries.
Each chart type requires a specific data structure, as described in the Chart Types section. The SQL query is entered in the App Wizard when creating a chart app and can be modified later at any time in the App Manager.
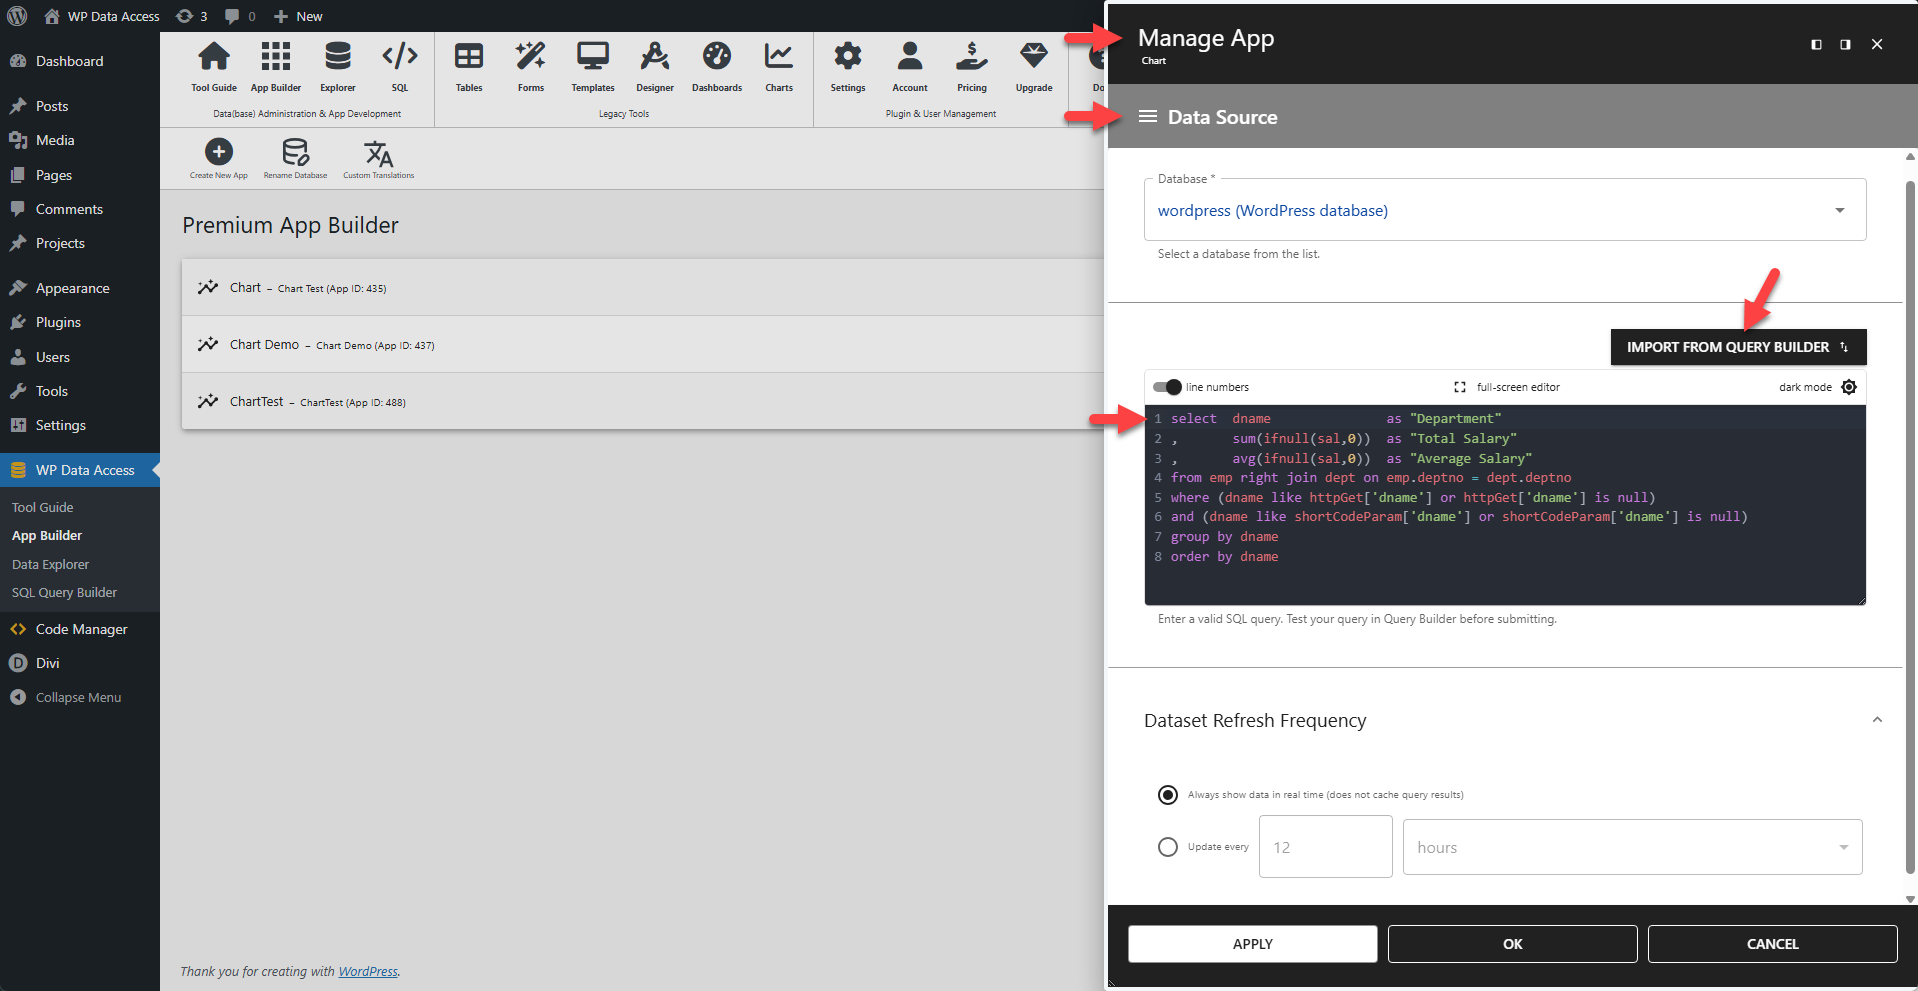
📌 Use the Query Builder to test queries before using them in a chart.
📌 Ensure queries do not return thousands of rows. This can negatively impact performance, and charts displaying thousands of values are generally not useful. Use a data table app to display large datasets.
User Interaction
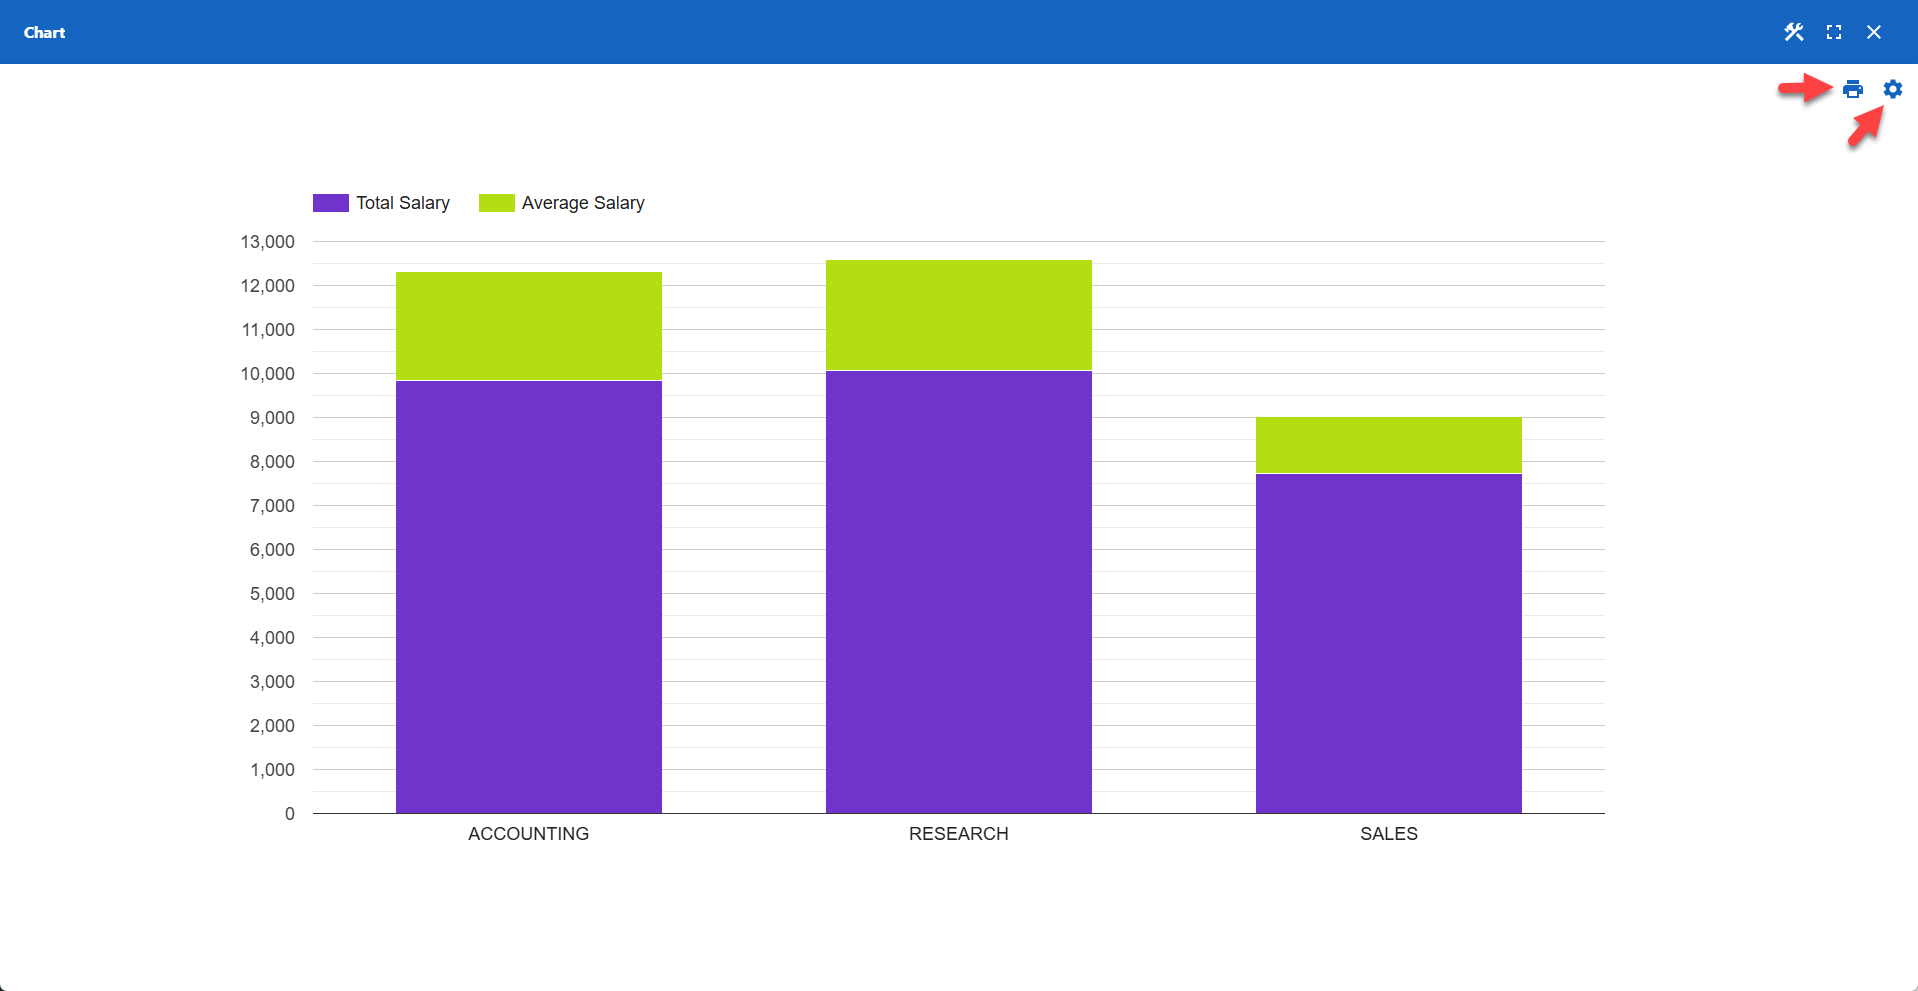
When a chart is displayed on a web page, users can:
- Click the print icon to print the chart (launches a print dialog).
- Click the settings icon to interactively modify chart settings.
Chart Settings Dialog
A variety of chart settings are available to users through a menu bar.
Preventing User Interaction
User interaction is enabled by default but can be disabled per chart.
> Disable User Interaction
> Disable Printing
Embedding Charts
You can also embed charts directly into a data table or data management app. This feature is available directly from the Table Builder.